This is part two in a two-part post about KPI’s. In part one I covered the definition of a key performance indicator (KPI), the 7 rules for choosing metrics that make the best KPI’s, and I provided some examples of bad KPI’s…ones that many ecommerce companies mistakenly use to measure success. Please read part one before reading on.
6 Metrics That Become GREAT KPI’s For An eCommerce Website
First off, it’s important to note that what works as a key performance indicator for one ecommerce store, might not work for another.
Each store has a different set of objectives and, therefore, a different set of KPI’s. Each site must create its own DM3 in order to truly find the ‘right’ KPI’s.
There is no such thing as a ‘standard’ list of KPI’s.
That being said, a few examples of great KPI’s for a ecommerce site are:
1) Conversion Rate
This is the starting point of all great KPI’s. It’s focused squarely on Outcomes, which is why you’re in business in the first place.
The average conversion rate for an ecommerce store is only 2%, and if you were paying attention I just listed an average. And we’re not supposed to measure averages, remember?
And that’s why we segment!
Conversion rate is a major KPI, but it becomes even more critical when we break it down into email registration conversion rate, email conversion rate, checkout page conversion rate, bing vs google pay per click conversion rate, referral program conversion rate…catch my drift?
All are important outcomes and are crucial in driving most ecommerce businesses forward.
2) Cart Abandonment Rate
Of all of the KPIs in this list, measuring cart abandonment rate will have the most immediate impact on the business.
After all, visitors who made it to the cart and/or checkout page were ready to hand over their money to you…but they left!

Measuring cart abandonment, and then taking action to improve, will have the most financial impact in the shortest amount of time.
It’s the first thing we looked at when Tipsy Elves came to us for help. And helped them recover 10.36% of abandoned carts. Their annualized recovery amount was $143,365.
3) Average Order Value (AOV)
There are only three ways to make more money in your business. You can increase the number of orders, you can increase prices, or you can increase the average order size.
Often times, increasing the order size is the fastest, and cheapest, way to bring more money to the business.
It’s especially important when you’re conversion rate KPI’s are telling you that you’re conversion rates are improving…yet you’re revenues are down! Head scratch.
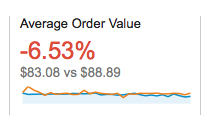
Making AOV a key performance indicator and using the data to test up-sell, cross-sell, and other promotional marketing methods to increase AOV can significantly, and positively, impact your business. Perfect example…Amazon.
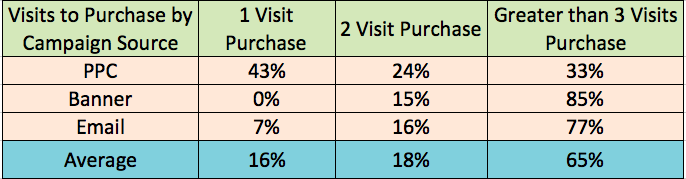
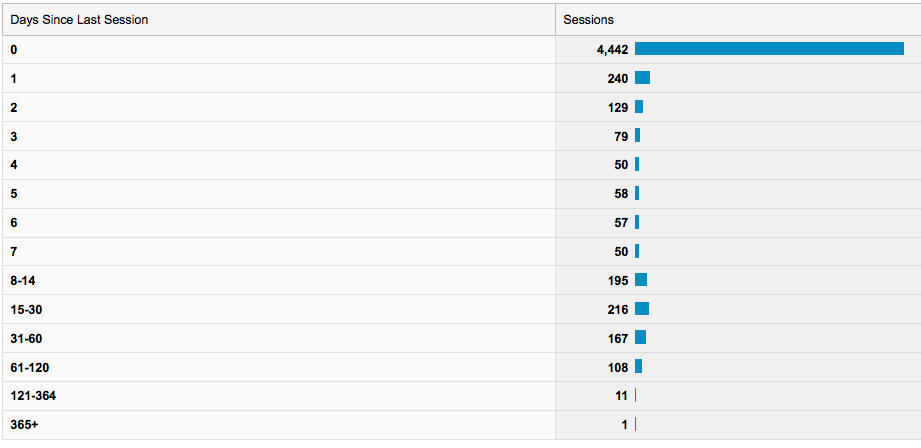
4) Days To Purchase/Visits to Purchase
This measures the real behavior a customer takes on your website and how long it takes them to complete an outcome on your site. Aka Pan-Session analysis, #4 from above.
Most ecommerce store owners measure conversion success as “the visitor came, they saw, they bought…or they didn’t buy.” That’s not a true measurement of success or failure.
Think about it. When you go to purchase something, online or off, you usually take you’re time. You visit a few sites or a few stores.
If you only measure the “one hit wonders” you might be missing out on the insights you gain about the success (or lack thereof) that your marketing campaigns and methods of driving traffic are having over multiple visits.
For even more insight, segment the data.
5) Visitor Loyalty and Recency
Another pan-session key performance indicator is to measure how often people are coming back to, and engaging with, your site.
As an ecommerce store, you’re probably doing multiple things to engage customers including things like a blog, Twitter, Facebook, YouTube, Instagram, etc.
So how do you know if all that content you’re consistently producing is having an impact? Measure it through loyalty and recency, then tie it to conversion rate.
6) Task Completion Rate
Here’s where you can take remove the analytics cloak that hides the real motives of your visitors. Data is still just a bunch of numbers and, yes, they do tell us a lot.
But no insight will ever compare to the actual voice of the customer.
Again, the average conversion rate for an ecommerce site is only 2%, the only way to know why the other 98% did not convert is to ask them.
Measuring the task completion rate will give you the exact reasons, straight from the customers themselves, about how your site is performing.
That best way to do that is by creating an in-session or an exit survey survey that asks three simple questions:
a) What was the purpose of your visit today?
b) Were you able to complete your task?
c) If you were not able to complete your task, why not?
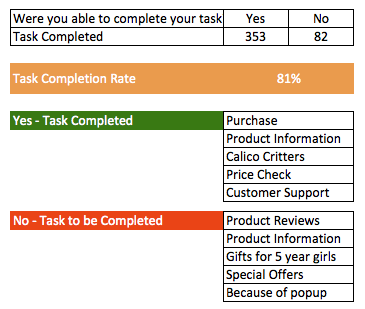
Make changes the customers want you to make, not what you think you should make.
7) Economic Value
Earlier in this post, I listed revenue as a potentially bad metric, and I heard a gasp when you read it. But we’ve also discussed the importance of pan-session analysis, and measuring total revenue would diminish the importance we placed pan-session analysis.
Measuring revenue is the same type of single-session measurement of “the visitor came, they saw, they bought…or they didn’t buy.” As we all know now, that’s not an accurate way to measure true success.
Obsessing over revenue encourages a company to focus on the “one hit wonder” purchases, which produces marketing that pressures the visitor into buying – today! I know most of us don’t like to be pressured to buy, so why would we do it our potential customers.
Economic value is the sum of total revenue plus the business value that is created by both macro and micro conversions.
Every micro conversion creates economic value for you business, so ignore the single session, “one hit wonder” obsession that is a revenue KPI.
 Monetize ALL actions taken on the site by using economic value.
Apply The “So What Test” And Routinely Chop
Now that we know the 7 basic rules to choosing great key performance indicator’s, and now that we have examples of both bad and great KPI’s, we still need to prove that the KPI’s we’re choosing are still providing deep, actionable insights.
A very simple way to determine if your KPI is great or garbage, is the apply the “so what test” (another Avinash Kaushik term. We learned from the best!).
For every web metric that you want to turn into a KPI ask the question, “so what” three times.
Each time you ask the question, your answer will product another “so what”. If, by the time you get to the third “so what”, you don’t have a solid recommendation for an action you should take, chop it.
The theory is, if you can’t take action, any action, then you’re wasting your time with that KPI. We only want the KPI’s that will help us taking action that has a meaningful impact on the businesses bottom-line. Everything esle is just “nice to know”…or it’s clutter.
Examples
Key Performance Indicator: # of Pageviews
You run a report and see a trend with this KPI.
You apply the “so what test”
“The trend of pageviews has been on the rise each of the last few months.”
(1) So what?
“This is great because people are exploring more of our site’s content.”
(2) So what?
“We should do more abc to keep the trend going.”
(3) So what?
First off, we’re still really not sure if the increased pageviews really mean we’re exploring more of the site’s content. Second, if your answer to the third “so what” is “I don’t know, I thought having more pageviews was a good thing…but I’m not sure” then it’s probably not a great KPI for you business.
Key Performance Indicator: Conversion Rate Email Marketing Content
Looking at your email campaigns with your marketing team you’re finding that overall email conversion rate has increased significantly
“The email conversion rate increased significantly from October through December last year.”
(1) So what?
“Well, we increased the amount of promotional emails that have discounts that correspond with US holidays, versus the random one-off weekly sales promotion emails, and they’re a much greater success. We should have our email marketing team plan out promotional emails for all US holidays this year. Based on the data, this could have an X financial impact on the business.”
There you have it. No need to ask another “so what?” As soon as a recommendation for an action is the answer to the “so what” question then that means you have a great KPI.
If you can’t find a recommendation for an action that answers a business question after the third “so what”, then you chop it. Simple as that.
Just remember, everyone’s situation is different it’s important that you ask the right questions and fill out the DM3 to help you make the right decisions for your business.
In summary, metrics that we can turn into KPI’s need to be able to answer business questions and they much product recommendations that help us taken action – spend more here, spend less there, do more of this, less of that.
Identify KPI’s that can do this for you, otherwise, like Yogi Berra said, “…you’ll end up someplace else.”
If you need some help identifying your KPI’s, feel free to email me at Chad@EcommerceInfluence.com and we can schedule a 15 minute chat to give you some direction.
Your turn (Leave your comments below): What KPI’s are you currently using and what type of actionable insights are you getting from them and how are they impacting the bottom-line?
Ecommerce Founder's Growth Pack
Enter your email to get our proven resources that will help you achieve massive growth without the burnout.

Featured Posts